mpl-arrow’s Documentation#
Easily plot nice-looking arrows with matplotlib
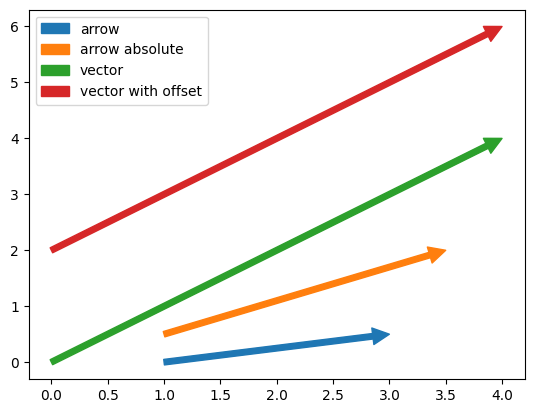
mpl-arrow provides functions for drawing arrows (vectors) between two points in data space. The arrow() function mimics the api of matplotlib.pyplot.arrow() but with defaults that allow the arrow to render nicely. Additionally arrow_absolute() and vector() provide alternative function signatures.
Key aspects of the functions are that they all:
Provide proper scaling of the arrow head
Follow the matplotlib color cycle
Can add legend entries
Install#
pip install mpl-arrow
Example#
import matplotlib.pyplot as plt

from mpl_arrow import arrow, arrow_absolute, vector

fig, ax = plt.subplots()

#     x, y, dx, dy
arrow(1, 0, 2, 0.5, label="arrow")

#              x,  y,  x2,  y2
arrow_absolute(1, 0.5, 3.5, 2, label="arrow absolute")

#     dx, dy
vector(4, 4, label="vector")

#     dx, dy, x,    y
vector(4, 4, x=0, y=2, label="vector with offset")

plt.legend()
plt.show()
Matplotlib is building the font cache; this may take a moment.